We wanted to address a recent client question that we thought made a great point. “If the S&P500 rises 7.71% this quarter and my account is up only 2% over the same quarter, am I losing out on return and is going to hurt my chances of achieving my goals in the long run?” To answer this, let’s first discuss some topics in behavioral finance that are important to understand.
In behavioral finance, much has been studied around the psychology of investing and why investors tend to earn less than the benchmarks. There are two main studies we would like to point out. Loss aversion and recency bias. Loss Aversion is people’s tendency to prefer avoiding losses rather than acquiring an equivalent gain. An example of this aversion is that the pain of losing $5,000 is about equal to the thrill of winning $10,000 because losing is emotionally more painful than winning.
As humans we put more emphasis on events that have happened recently over events that happened past, this is known as recency bias. An example of this is the adage, “what have you done for me lately?” One of the mistakes many investors make is to put too much emphasis on current returns or short term returns over long term returns.
I believe an advisor’s job is to continually point clients toward the long-term goals by expanding our view past the last quarter or even 1 year. There is a lot of noise made by the media over short-term market swings that derail a good plan. We believe investors must have a least a 5-year horizon to own stocks because of their short-term unpredictability.
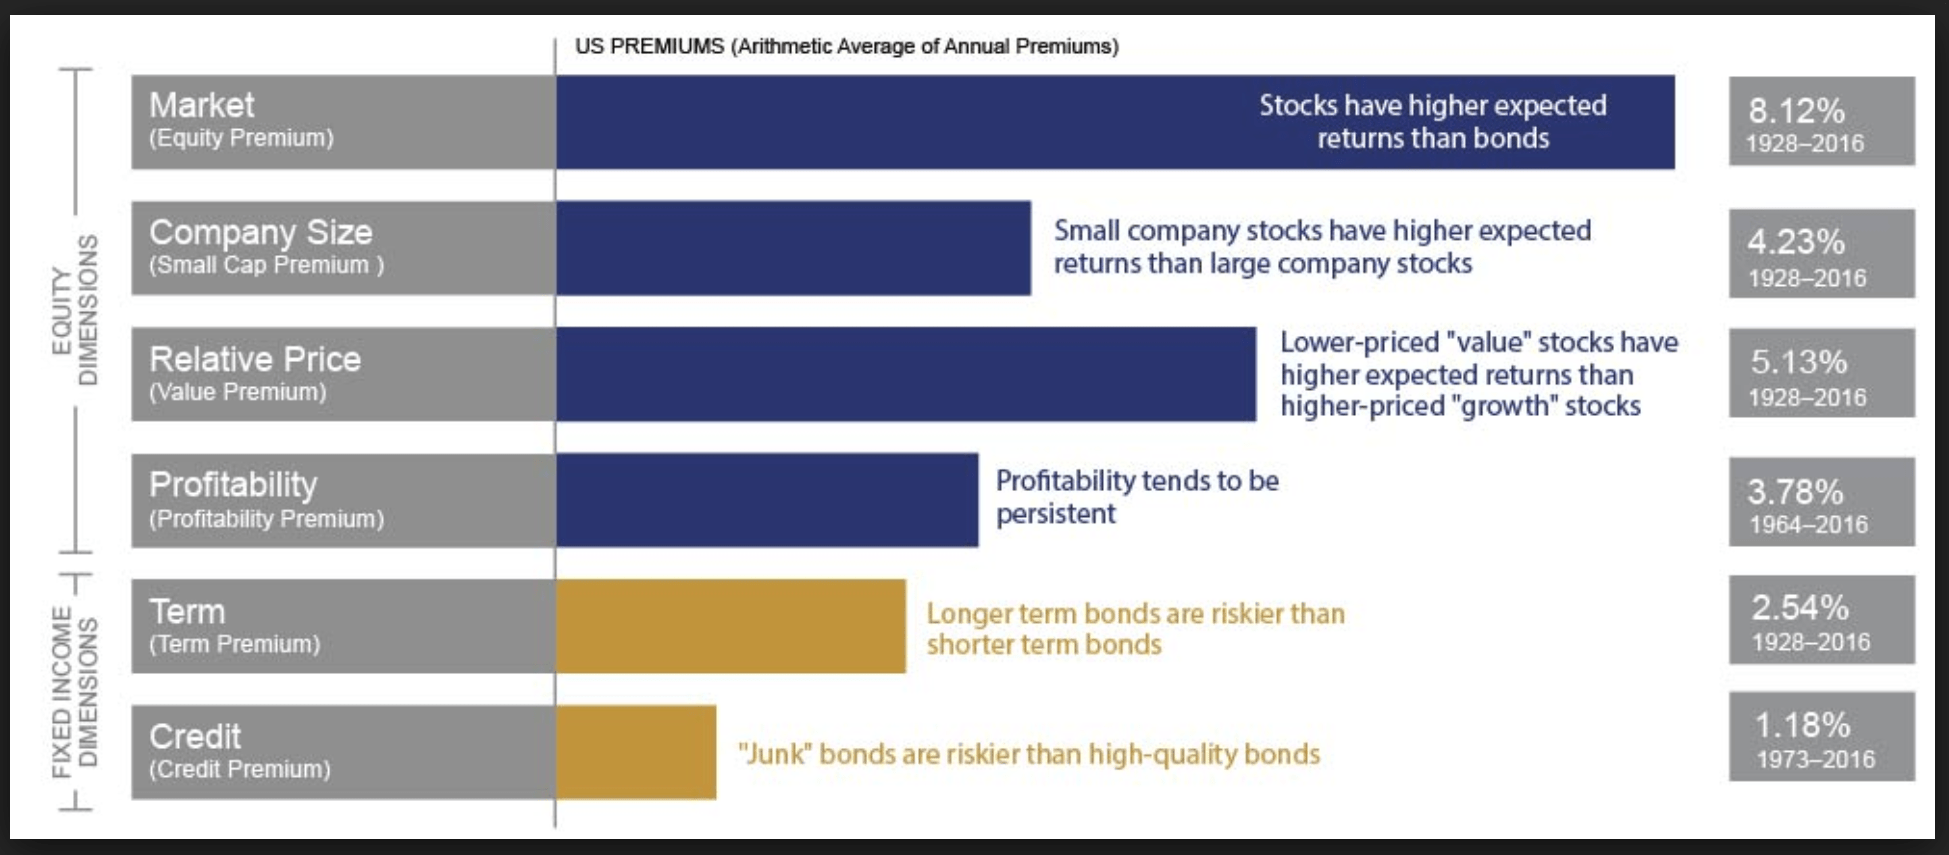
Next if we shift our focus to the academics, Professors Fama and French have helped explain the long-term premiums (a premium is an extra return that is available over the entire index) that have existed in the following market areas. All we must do to capture some of the extra returns is hold these sections of the market in a greater weight than other markets like the S&P500. The disadvantage is we don’t know when these premiums will show up, but currently they have been in all major markets overall long-term time periods. To further that in rolling 10 years data these premiums typically are positive over 70-80% of the time depending on which factor. They are very persistent.
Figure 1
Recently MWA’s Models have lagged because they have a greater tilt toward the value premium which has lagged growth portfolios. Having international factors has hurt recent performance but it has helped over the long haul. US technology stocks led by the four internet giants have lifted the US Indexes that own a greater share of Large Growth. The S&P500 has been a benefactor of how the index weights its securities. However, I feel certain that if you examine the research you will conclude that the S&P500 will eventually lag a globally diversified equity portfolio that tilts toward the factors listed above.
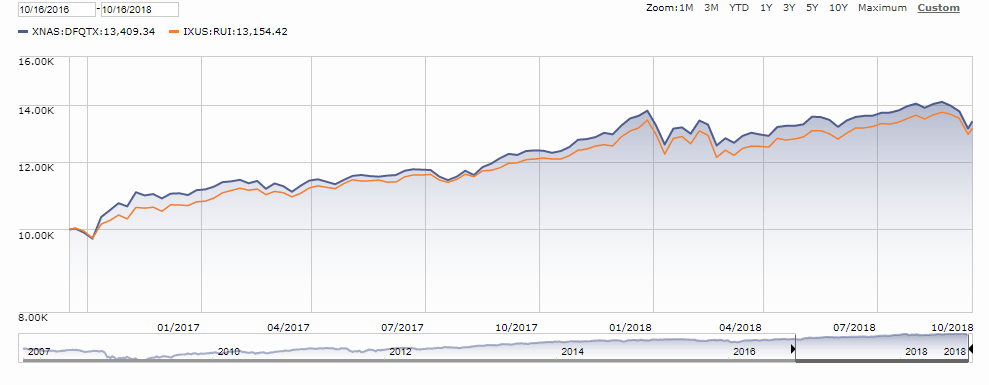
We typically recommend choosing a portfolio objective based on achieving the highest return over time with the least chance of failure. More diversification by assets that move up and down help accomplish this objective as does a systematized rebalancing policy. Below (in figure 2) you can see an example of the 2-year return of one of our main US Equity Funds (Blue Line) which has a greater exposure to smaller companies and value companies as compared to the (orange line) index which owns more Large Growth assets. The main US Fund we own has done better in the past 2 years vs its benchmark. Over that 2-year period it has beat its benchmark by close to 1.5% per year.
Figure 2
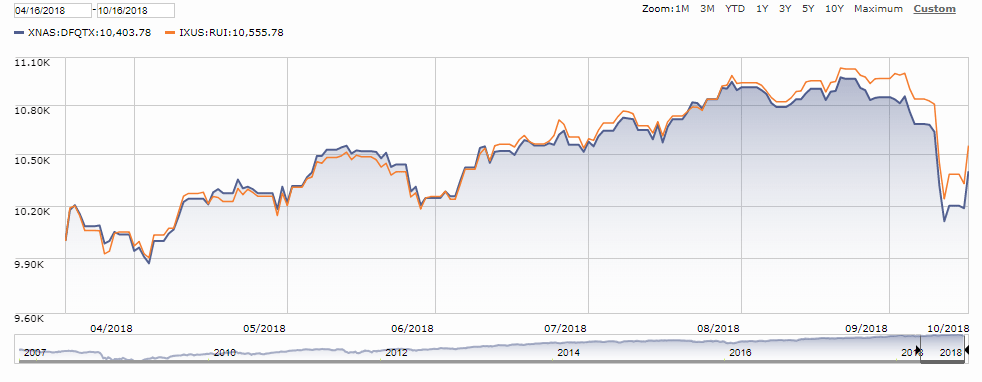
Figure 3 (below) is how the same fund has done vs its benchmark over the past 6 months. It has done about 1.5% below the benchmark in that time frame. A stark contrast from the 2-year graph (above).
Figure 3
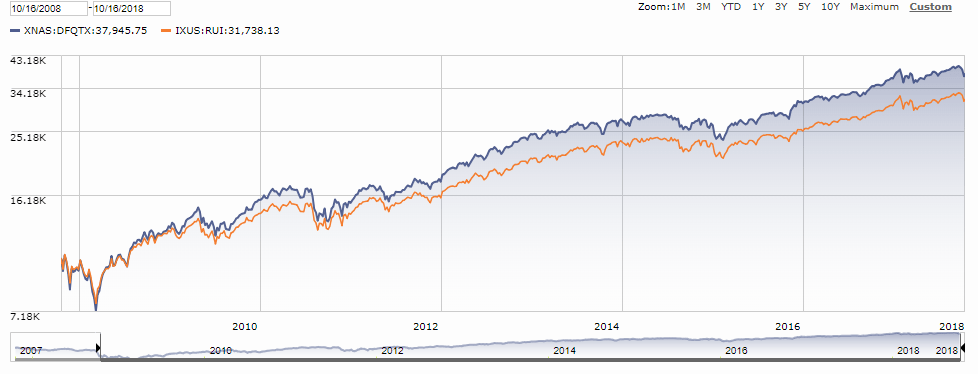
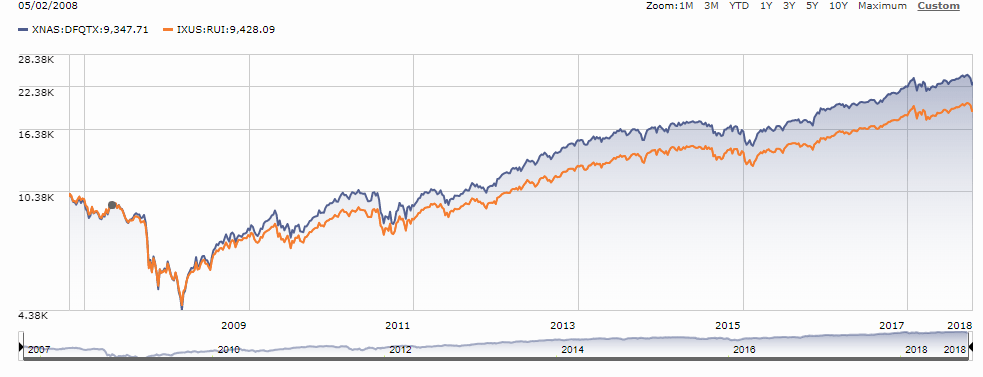
Recency bias would suggest that this fund is underperforming, and many investors would sell it for another that they felt was performing better. However, this time horizon is too short to make a decision like that. If we expand our horizon we will see that this fund has outperformed the benchmark dramatically over the past 10 years and since its inception. You can see this in Figure 4 and 5 respectively. Therefore, this fund is not a fund that should be replaced.
Figure 4
Figure 5
By expanding our horizon to 10 and 13 years we are able to see that this fund has vastly out performed its benchmark and has a track record of success. Does past returns guarantee future returns? Never! With conventional investing based on guessing which small set of stocks will out-perform the benchmark, past returns are a poor reflection of potential future performance. In contrast to this, we use a diversified portfolio that consists of the same assets as the index or benchmark. What we do is overweight or tilt our portfolio toward the long-term premiums that academics have identified to have the potential to outperform the index over a long period of time.
This phenomenon of funds that have traditionally outperformed their benchmark now underperforming in the short run is a common theme right now across the world. This could be attributed to the fact that there are a handful of stocks that are bringing the benchmarks higher because they are overweight in those. Today it seems eerily similar to the nifty fifty stocks back in the 60s and 70s (50 stocks that traded at ultra-high values before a correction).
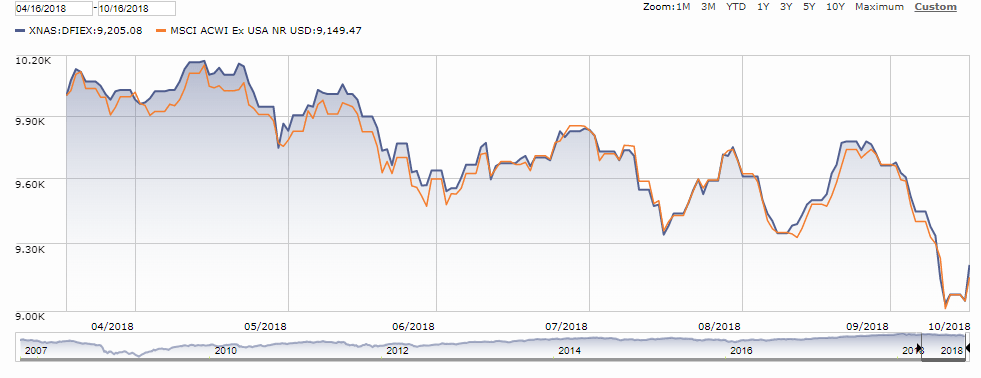
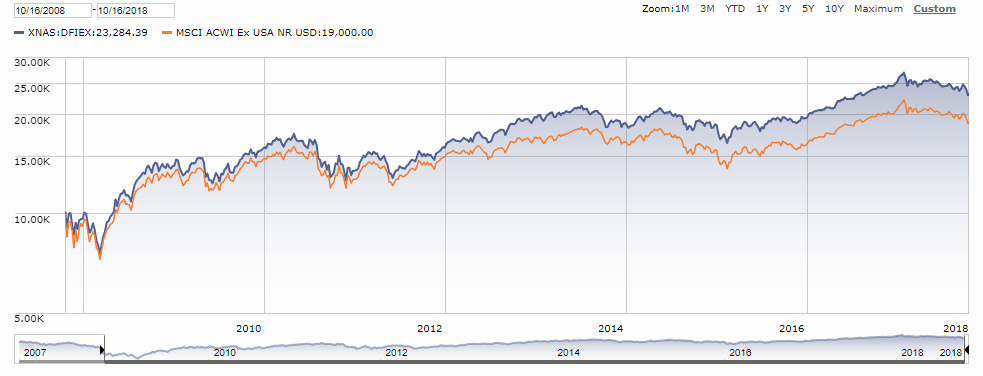
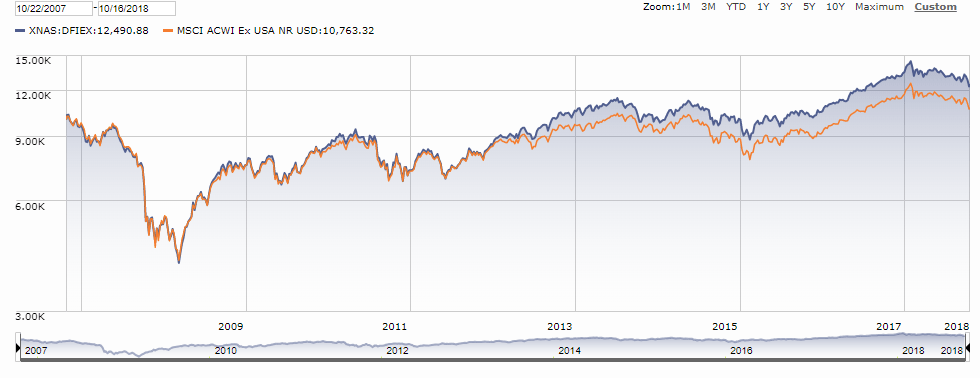
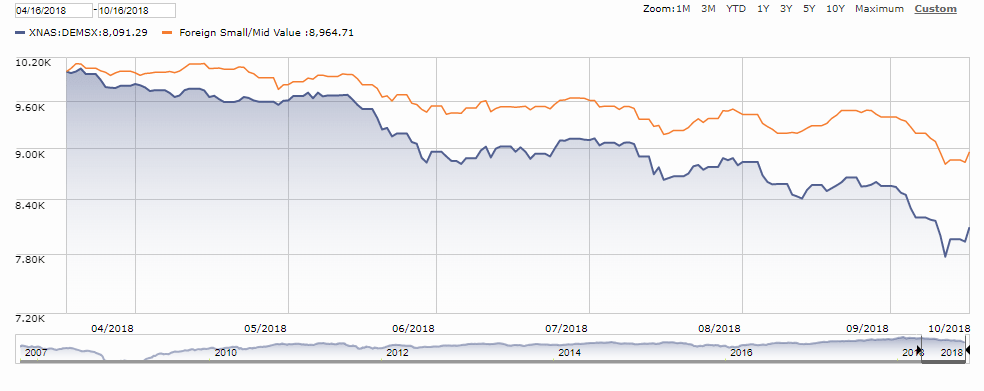
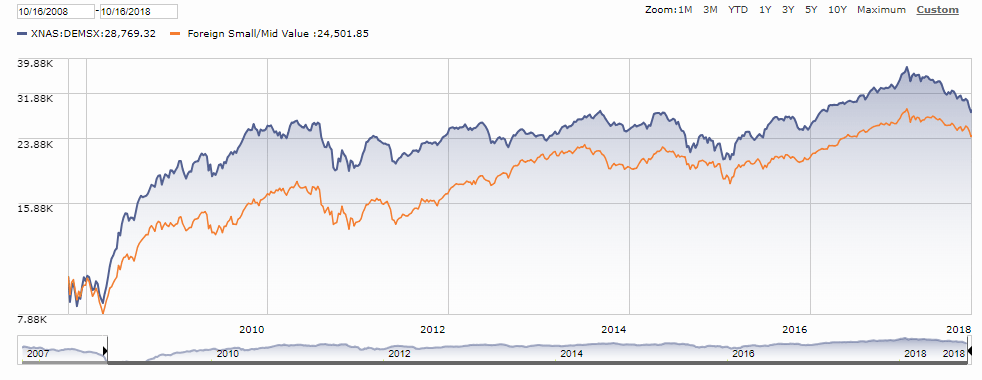
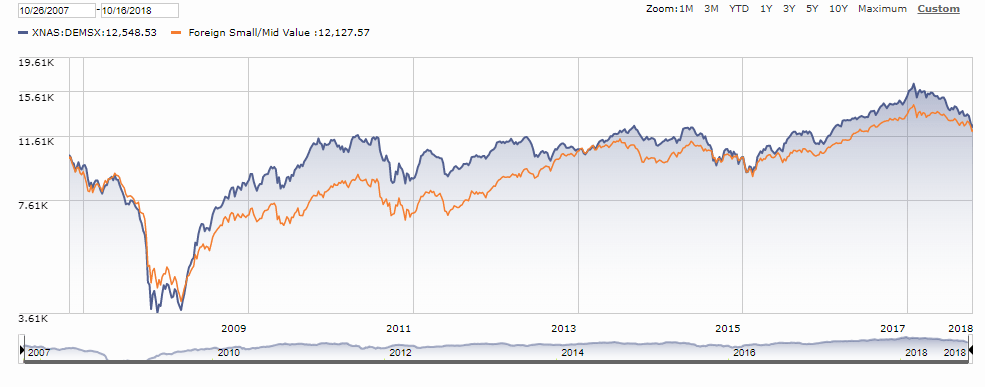
Below you can see how our International equities and Emerging Market equities have done over the same time frames (figures 6-11)
6 Month return of one of our International Equity funds (blue) vs its benchmark (orange) Figure 6 (above)
10 Year return of one of our International Equity funds (blue) vs its benchmark (orange) Figure 7 (above)
Since Inception return of one of our International Equity funds (blue) vs its benchmark (orange) Figure 8 (above)
6 Month return of one our Emerging Market funds (blue) to the benchmark (orange) Figure 9 (above)
10 Year return of one our Emerging Market funds (blue) to the benchmark (orange) Figure 10 (above)
Since inception return of one our Emerging Market funds (blue) to the benchmark (orange) Figure 11 (above)
In conclusion, we do not want to overreact to a portfolio underperforming the S&P 500 (or any other benchmark) for a quarter, 6-months, year, or any other short-term horizon. It’s important to remember that (1) short term returns are too short to use as a measuring stick, (2) MWA portfolios are globally diverse and not all countries and markets rise and fall at the same time.
This doesn’t mean that we shouldn’t analyze our strategy or positions though, we just need to use short-term and long-term data together. We analyze our positions daily and are constantly researching if the strategies are working as designed. More often than not, after research we are able to find that the strategies are still in the best interest of clients and we just need to wait out the storm. We still feel that our strategy is a strategy that will win long term.
As for this year so far, International funds and Emerging Market funds (which makes up about 50% of our equity) have not performed well (just like their benchmarks!). Clients are seeing that their portfolios aren’t matching what the S&P 500 has done this year and this is causing some fear of losing out, the key is to make sure you are comparing apples to apples. In the short run we can’t compare the S&P 500 to Emerging Markets or International equities because they are not apples to apples. Loss aversion and recency bias create emotional responses in all of us and may try to tell us that a strategy doesn’t work, and it should be changed. If you are feeling this way, I ask you to look below (one last graph I promise!) and see what a globally diversified portfolio has done in the long run vs the S&P 500.
I believe the tools we use work over the long term. Over the short run, we just need to be patient, ignore the media noise, and trust the academics, who are the least biased members of the financial markets.
Figure 12
Investment advisory services are offered through Mills Wealth Advisors, LLC , a Registered Investment Advisor. The firm and Investment Advisor Representatives of Mills Wealth Advisors, LLC, may only conduct business where they are properly registered or are exempt from registration requirements. Registration with the United States Securities and Exchange Commission or any state securities authority does not imply a certain level of skill or training. The firm is not engaged in the practice of law or accounting. All investment strategies have the potential for profit or loss.
Read our market commentary
Read our investment tips
Learn more about us


