U.S. stocks inched higher in the third quarter and finished near record highs, while bonds and real estate lost ground. Investors stayed focused on artificial intelligence, record corporate profits and a resilient U.S. economy, and they looked past higher oil prices and plenty of uncertainty around the world.
That strength comes with a price. Many of the large growth companies that have driven returns for years now trade at some of the highest valuations we have ever seen. Investors own more stocks than ever, fund managers hold very little cash and margin debt sits near record levels. Markets can keep climbing, but the more you pay today, the harder it becomes to earn the same returns over the next five to ten years.
Meanwhile, high-quality bonds pay yields we have not seen in decades. That raises a fair question: Is now a good time to take a few chips off the table and add a little more defense?
In this quarter’s letter, Mike uses a little Texas history, the Barnett Shale boom and bust, to explain why the AI build-out may follow a familiar cycle and why now is a good time to confirm your portfolio still fits your goals. We also cover year-end tax moves under the new rules and introduce our new office manager, Sammi.
Use the links below to jump to any section of this newsletter.
SECTION I – Quarterly Market Review
SECTION II – Mike’s Commentary, Questions, and Quotes
SECTION III – Year-End Tax Moves for the New Rules
SECTION IV – Around The MWA Office
SECTION V – Pictures Worth Looking At
Quarterly Market Review
The third quarter of 2026 delivered mixed results across the major markets. The U.S. stock market led the major equity markets with a 1.41% gain, followed by International Developed markets at 0.89%. Emerging Markets declined slightly by 0.37%, while Global Real Estate experienced a larger decline of 6.03%. Fixed income markets also faced headwinds, with the U.S. Bond market declining 3.51% and Global Bonds (ex-U.S.) falling 1.79%.
Despite the weakness during the quarter, the longer-term picture remains positive. U.S., International Developed, and Emerging Markets stocks have all generated positive returns over the past 1, 5, and 10 years. Global Real Estate has also produced positive returns across each of those periods. Global Bonds (ex-U.S.) have delivered positive returns over the 1-, 5-, and 10-year periods, while U.S. Bonds have been positive over the 10-year period despite recent declines. To read the full Market Review Deck CLICK HERE.
Mike’s Commentary, Questions, and Quotes
I’m sure most of you Texans know of the Barnett Shale – this is the rock formation located around Fort Worth that was loaded with natural gas, oilmen always knew it was there, but it was commercially unproductive. That all changed in 1997-1998 when completion engineer Nick Steinsberger working for Mitchell Energy refined their completion process with a sand & chemical mix on the S.H. Griffin Estate. Their new process was cheaper than previous methods and produced gas in substantially higher volumes, often recovering all of their cost in a few years. This change in technology set off a race to produce the natural gas trapped in shale formations around the world before prices changed. Prior to the sand-fracking Revolution that started in Fort Worth, natural gas traded for $2/MMBtu in 1998 and frantic demand drove prices all the way up to $15/MMBtu by 2005. Input cost for acquiring land started out paying landowner’s leasing bonuses for $500 with a 12.5% royalty, but that quickly rose to $30,000/acre for a 5-year lease with a 25% royalty on future production. These were fat prices, that like most booms, eventually proved unsustainable.
What happened next? Everyone rushed to drill. Oil & gas guys threw money around like Brewster’s Millions, opting to go fast and try to make it before something changed. The early pioneers Mitchell, Chief & XTO all sold out and made billions. The rest lost billions when supply increased and prices fell from about $12 in 2008 all the way back down to $1.95/MMBtu in 2012. Deals that made tons of sense at $10 were bankrupt at $5 and even worse at $2. Since 2012, prices have mostly stayed between $2 and $4 because America has been oversupplied with natural gas. Cheap fuel has been a major factor in driving Texas growth.
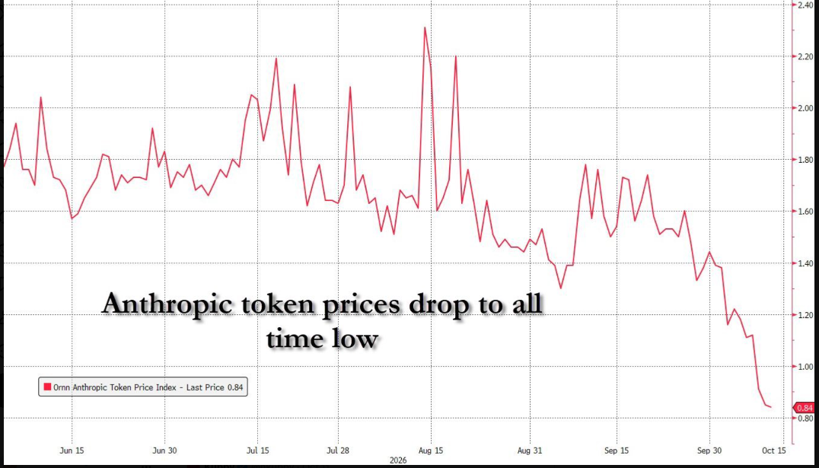
Now you might be asking what does this history lesson have to do with today? Natural gas, like compute, is basically a commodity. Companies want the job done and if compute is going to drive AI agents, not all jobs are going to require cutting-edge frontier models and Nvidia chips. Many of the chips being used through the data center ecosystem will be powered by commodity products (whichever chip can do the job at the lowest price or best value.) Industries are viewed as commoditized when users can substitute out competitor’s products, and they are viewed as basically the same.
Compute, chips, and memory (while technical) are commodities too. Chips are in everything and are extremely cyclical, just like natural gas. When demand increases, and supply is the same, prices rise. When prices rise, producers ramp up production and race to meet demand and more chips are produced until prices fall and supply & demand meet. If it’s being used inside a data center today, you can bet the company is running shifts around the clock squeezing out as much production as possible and investing to ramp up its production to the max. Additionally, Amazon and Google have started making their own chips to reduce their dependence on industry leaders like Nvidia and Broadcom. When demand outstrips supply, prices rise until capacity comes online. Because this process can take years to balance out, it is loaded with boom-and-bust cycles. Today, companies out on the edge are making enormous amounts of money. Nvidia, for example, earns gross margins around 70%, is growing revenue rapidly and has signed high-value long-term contracts. The company is now worth an eye-popping $5 trillion. As their margins might suggest, they are far from commoditized because they are a complete ecosystem, not just a GPU. But many of the other players are more substitutable. Some of the same chips behind making compute are the same ones in your computer, car, fridge, and camera. They are extremely price sensitive.
When you get a shortage because there is more demand than can be produced, prices will rise and companies make lots of profit from selling to meet demand, usually some users will hoard hard to get chips; making it look like even more chips are needed than what’s required in a normal year. Next FOMO kicks in, demand drives up prices, companies invest, supply eventually comes online causing prices to fall. The bust typically occurs when excess supply doesn’t have a buyer, so prices are quickly cut to recoup cost needed to repay loans and ends when there is excess supply at low prices, leading to large losses and eventually to bankruptcies (and the cycle repeats). The million-dollar question is when might this happen? I’m smart enough to know prediction is not my game, it could be years in the future, or it could be around the corner, but one day it will end, and investors need to be ready.
The early companies that invest and sell compute first will make great money; they are effectively getting in before prices get bid up like Mitchell Energy, but the folks that roll the early profits forward will eventually get caught in a trap of falling prices. The companies that are legally committed to finishing the data center (their gas well) at the top of market, after prices have reset lower, and are no longer economic, will eventually get squeezed destroying shareholder value. With Amazon and Google making their own chips, and traditional players ramping production or figuring out how to do more with less, you can bet eventually supply will catch up with demand.
Implications of My Little History Lesson:
Markets have had a great run, and a breather may be coming. If your time horizon is shorter, now is a good time to confirm you are still comfortable with your portfolio’s risk. We want to be sure we still have it right. Leaning a little more conservative may make sense, especially in tax-deferred accounts. The information below explains why.
____________________________________________
- Who is left to be the incremental buyer that pushes stocks higher?
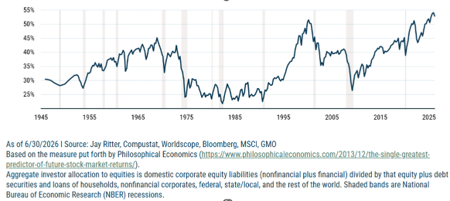
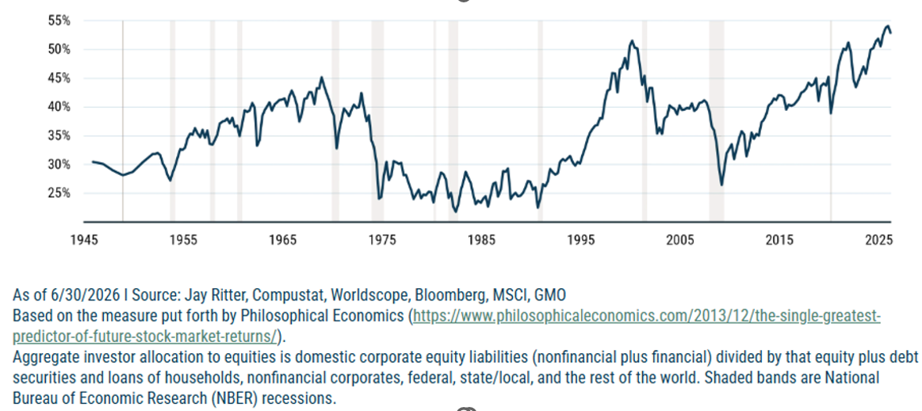
- Allocation to Equities: 55% (Highest ever)
Americans now own 55% of portfolio in Stocks (Highest ever) Who is the incremental buyer that makes markets rise further when investors already holding more stocks than ever before. This is a bearish fact.
Figure 1A: Aggregate Investor Allocation to Equities: 55%
B: BofA Global Fund Manager Survey, October 2026: Cash Holdings & Positioning:
A cash reading below 5% means fund managers are fully invested, so there is not much money that can be used to buy equities. BofA treats this as a contrarian sell signal: “Average cash holdings remained low at 3.9% of assets under management, continuing to sit in contrarian “sell signal” territory (triggered when cash drops to 4% or below).”
Figure 1B: Sentiment Indicators:
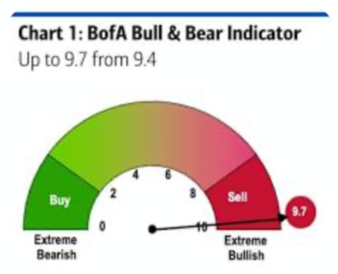
- Sentiment Context: Extreme investor optimism has preceded many past market highs. BofA’s signature Bull & Bear Indicator peaked at 9.7 in August 2026 (its highest level since 2021) before hovering above the bank’s 8.0 sell threshold. [1]
We are not recommending market timing. We are recommending that you decide in advance how much defense you want, and whether an investment that might zig when the AI trade zags belongs in your portfolio. That is just prudent risk management.
“Longer-term risks remain elevated: near-record household equity exposure and surging leverage have historically pointed to weaker forward returns, while the economy’s growing reliance on the stock-market wealth effect raises the stakes of a potential prolonged downturn.” (1)
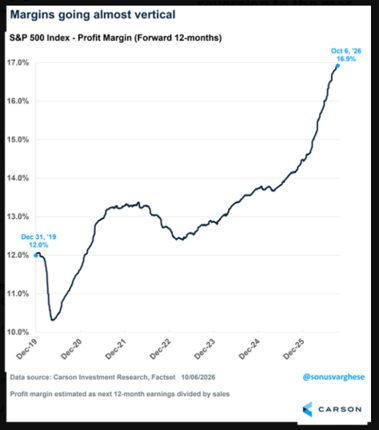
- High US Company Profit Margins: Profits are the highest ever. Most of the money that can be squeezed out is in the past probably not the future. With higher input cost (high oil prices), higher energy cost for electricity, higher interest expense, higher tariffs, how much more profit can be squeezed out of companies. At some point profit margins will revert downward from today’s records. Buffett is known for warning that it is hard for economies to consistently produce profits above 6% of GDP. We are at 13.1% of GDP today, highest profitability on record. Maybe, as economist Irving Fisher famously said just before the 1929 crash, we “have reached what looks like a permanently high plateau.”
Figure 2: S&P 500 Profit Margins (Forward 12 Months)
IV. Higher interest rates might pull some money from Stocks now that yields have risen:
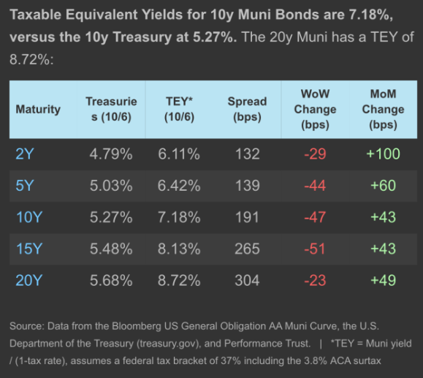
The highest quality Treasury bonds are yielding 5.67% for 20 years. If rates fall in the next recession, these bonds could also gain in value on top of their yield. Many strategists I follow expect that lower-risk bonds will likely exceed the returns of higher risk over-owned growth stocks over the next decade. High-quality bonds have also often held up when stocks fall, though not always. See Figures 3 and 4.
Figure 3: Interest rates now .8% above the long-term average since 1800. Might this pull money away from stocks? Interest rates are up to attractive levels not seen since 2007.
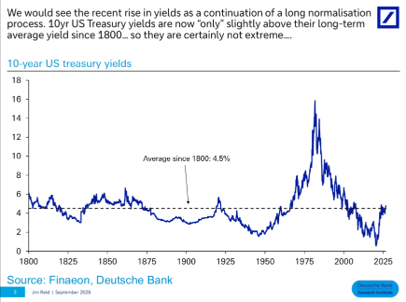
Figure 4: Tax Free Bond Equivalent Yields offer higher after tax rates
Buy Low – Bonds look pretty low vs history and offer attractive income with less risk than stocks. Remember, if stocks decline, interest and principal can be redirected back to stocks or whatever is on sale. We bought 20 year bonds at 5.76% + any cap gains.
Figure 5: Best Time to buy bonds in past
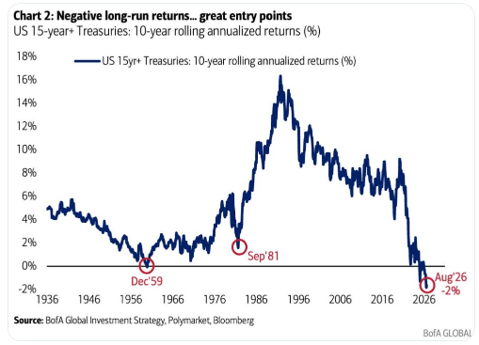
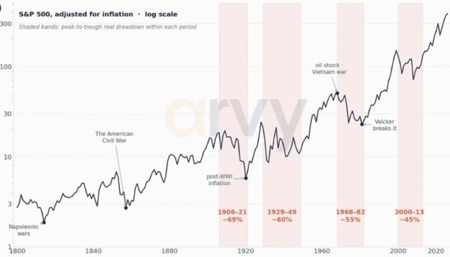
Figure 6: What typical bear markets have cost in real terms (%): When markets get really expensive and bearish we think this is a wise time to raise enough cash, so that you don’t have any regrets if markets fall.
Source: Thierry Borgeat (via X)
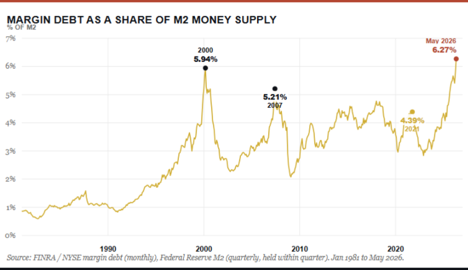
Figure 7: Margin Debt: Margin debt (or borrowed money used to buy stocks) is at some of the highest levels ever. This is a negative indicator because there are fewer investors with dry powder to buy equities. Historically, high margin debt has been a contrarian warning sign.
Understanding increased supply of shares from SpaceX, OpenAI, & Anthropic IPOs and eventual unlocking that will bring excess supply of shares into the market.
“In 2000, a record number of tech IPOs and secondary offerings overloaded markets with supply of stock, when lockups expired prices fell. Stock supply is one of the main factors that is credited with pricking the tech bubble in 2000.”
How big are these collective IPOs relative to history?
The AI build-out is attracting extraordinary amounts of capital. Could the catalyst for a potential bubble break come from equity supply rather than disappointing AI demand?
- Bubbles need fresh capital, and rising supply often breaks them.
- In AI, that supply may come through SpaceX lockup releases, the likely IPOs of Anthropic and OpenAI, and hyperscaler-driven secondary issuance.
- Today’s passive, benchmark-aware, and constrained markets leave fewer buyers willing to absorb new equity supply.
- Data suggests each 1% increase in equity supply has historically cut market value by roughly 4% over the next year.
- Rising supply could pressure returns before weak AI economics become obvious. GMO
Source: GMO, “A Catalyst for the AI Bubble Break,” Quarterly Letter
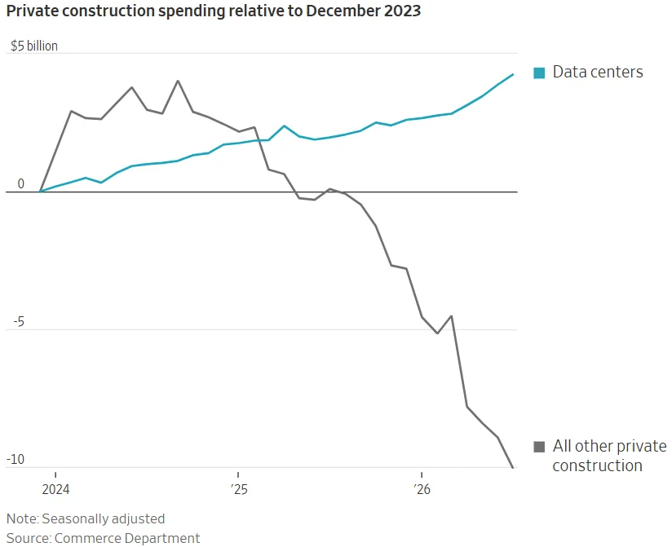
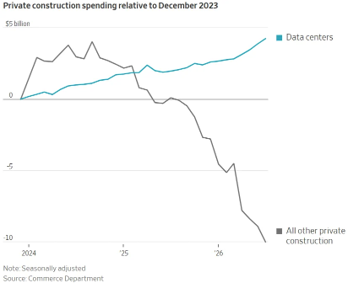
Figure 8: Non-AI Construction Spending: Many areas of the market are struggling under higher interest rates, except data center spending. Some economists believe we would be in a recession right now, if it were not for data center spending
To wrap this up with a bow, as a guy that lets goals drive the bus, when you get ahead of your goal, and markets begin to feel really expensive and indicators start flashing yellow caution lights, it’s perfectly okay to add some extra money to defensive investments especially ones that are paying a decent return. We have just experienced some of the best 15-year US returns in history, especially when viewed net of inflation.
Make sure you know what you want out of your portfolio or discuss it with your advisor, so your portfolio’s characteristics match your expectations. This makes riding through the inevitable bumps a little easier. Don’t kid yourself into thinking you are a long-term investor and then feel regret or guilt if your favorite investment declines.
All the best & thank you for trusting us with your money.
–Mike Mills, CFP
Tax Corner: Year-End Tax Moves for the New Rules
Last quarter we covered the new charitable giving rules. The 2025 tax law changed much more than charitable deductions, and several of its provisions affect our clients directly this year. Most of the best planning opportunities close on December 31, so now is the time to review them.
Property taxes and the higher SALT cap
For 2026, the cap on deducting state and local taxes rises to $40,400, up from $10,000. Texas has no state income tax, but Southlake property taxes alone can exceed the old limit. The catch: the higher cap shrinks once your modified adjusted gross income passes $505,000 and drops back to $10,000 for many high earners. If your income sits near that line, the timing of a bonus, a business distribution, a Roth conversion or a capital gain could decide whether you keep the larger deduction. Paying your 2026 property tax bill in December rather than January may also make a difference.
A smaller benefit for top earners
Taxpayers in the 37% bracket now receive no more than 35 cents of tax savings for each dollar of itemized deductions. It is a modest haircut, but it changes the math on large deductions, including bunching charitable gifts.
Catch-up contributions go Roth for higher earners
Starting this year, if you earned more than $150,000 in wages from your employer in 2025, any 401(k) catch-up contributions must go in as Roth. You pay the tax now instead of in retirement. If your plan does not offer a Roth option, you may lose the ability to make catch-up contributions altogether. Business owners should confirm their plan is set up correctly. Savers ages 60 to 63 can contribute an enhanced catch-up of up to $11,250 this year.
A new deduction for those 65 and older
Through 2028, taxpayers age 65 and older can claim an additional deduction of up to $6,000 per person. The deduction phases out above $75,000 of income for single filers and $150,000 for joint filers. Many working clients will not qualify, but retirees in lower-income years may, which makes the size of any Roth conversion especially important.
Estate planning certainty
The federal estate and gift tax exemption is now $15 million per person, or $30 million for a married couple, with no scheduled expiration. That gives families a stable foundation for gifting and trust planning, though Congress can always change the law in the future.
What to do now
The right moves depend on your projected income, deductions and goals. We are reviewing several questions with clients now. Should you accelerate or defer income? Does a Roth conversion make sense this year, and how large? Are there investment losses to harvest against gains? Do your retirement plan contributions match the new rules?
Waiting until the last week of December limits your options. We coordinate with your CPA so the plan and the return line up.
Please reach out to us with any questions or to schedule a year-end tax review.
Around the MWA Office
It took us a while to find the right person, but we are excited to introduce Sammi, our new office manager. Sammi joins us from Metroport Meals on Wheels, an organization built on showing up for people, and she brings that same mindset to Mills Wealth. She also brings experience from the assisted living industry, where she worked her way up through a variety of roles into Business Director, developing strong skills in organization, client support, and keeping day-to-day operations running smoothly. Outside of work, Sammi is a proud mom to her 21-year-old son, Ben, who is a mechanic, and happy owner of her two dogs, Sweet Tea and Odie. She loves exploring our beautiful country, volunteering, discovering new places to hike, browsing antique malls and gemstone mining.
When you call our office, Sammi will likely be the first voice you hear. She can handle most requests on the spot, from paperwork and account questions to finding time on your advisor’s calendar. When something needs your advisor, she makes sure it reaches the right person quickly. Next time you call, please say hello and welcome her to the MWA family!

Pictures Worth Looking At
Figure 1A: Aggregate Investor Allocation to Equities
Sentiment Indicators: BofA Bull & Bear Indicator
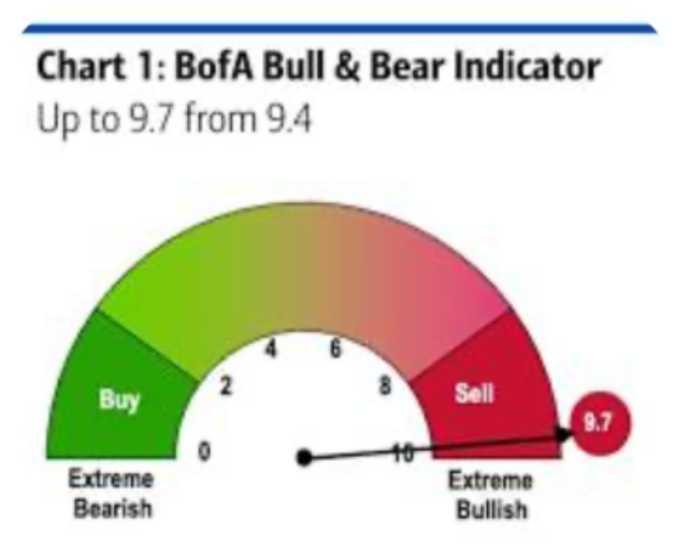
Figure 2: S&P 500 Profit Margins
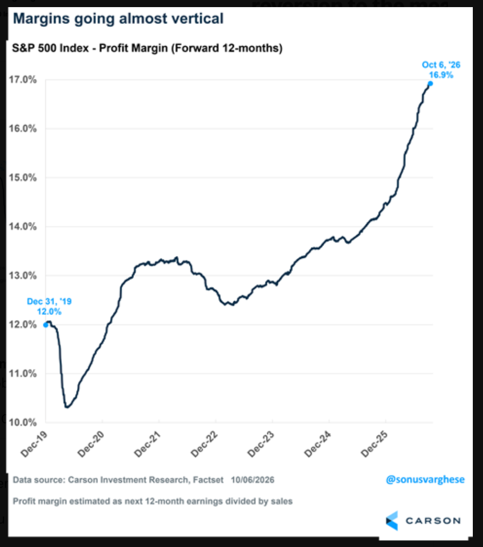
Figure 3: 10-Year US Treasury Yields Since 1800
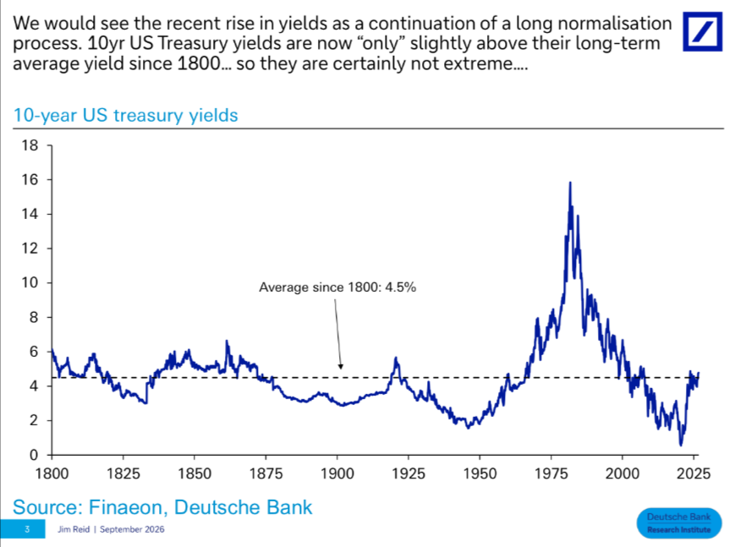
Figure 4: Tax-Free Bond Equivalent Yields
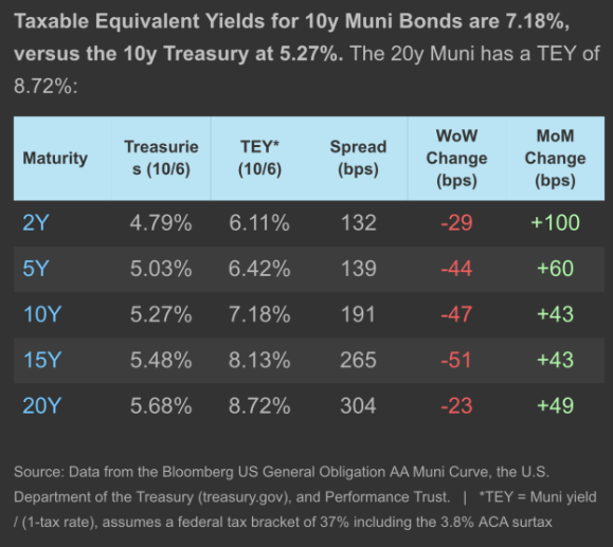
Figure 5: Best Times to Buy Bonds in the Past
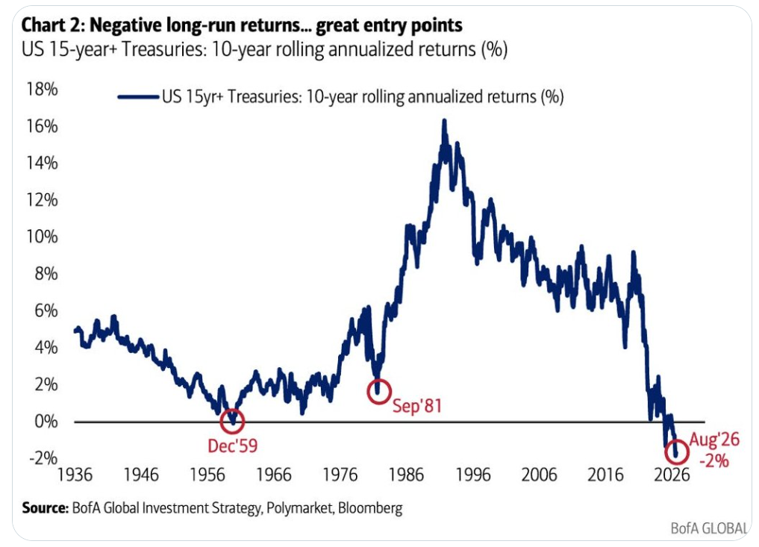
Figure 6: What Typical Bear Markets Have Cost in Real Terms
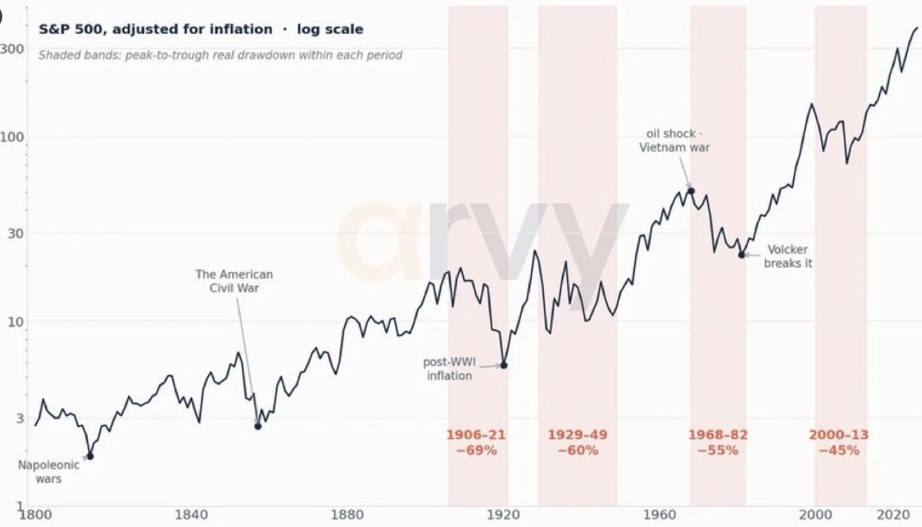
Figure 7: Margin Debt as a Share of M2 Money Supply
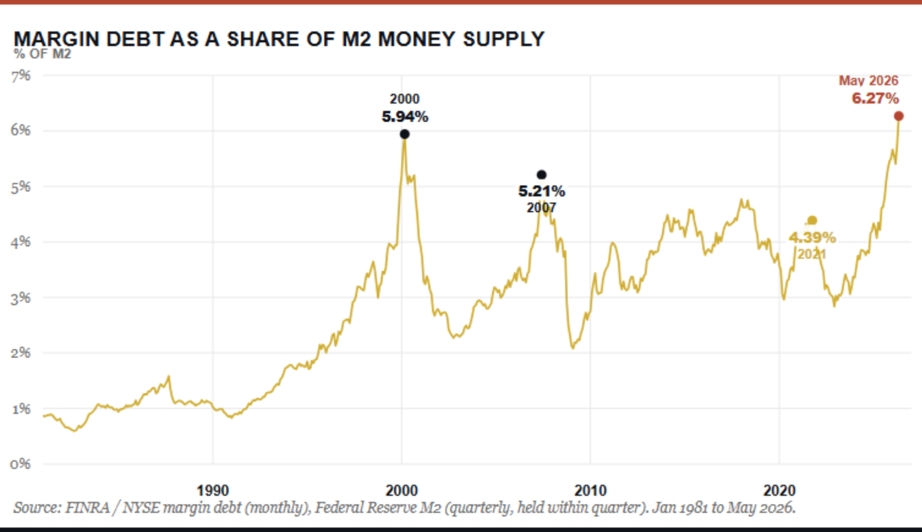
Figure 8: Non-AI Construction Spending vs. Data Centers